Reading a Q-space plot
When the transformed space has two dimensions, the whole model can be drawn. Here is how to read the picture.
When the map has two dimensions, the whole model becomes a picture. Here is how to read it.
How to read the picture
When the map has two dimensions, the whole model becomes a picture. Each class gets a colour, used both for its examples (the dots) and for the territory of its vortices (the background). Reading it takes four rules:
- A dot on a background of its own colour is correctly classified.
- A dot on a background of another colour is a mistake, visible at a glance.
- Tight, well-separated islands mean the model found a crisp rule. Wide, overlapping blobs mean the rule is loose or poorly learned.
- Two islands of the same colour far apart mean the class has two sub-rules, like the two ways people write the digit 1.
A good map and a poor one
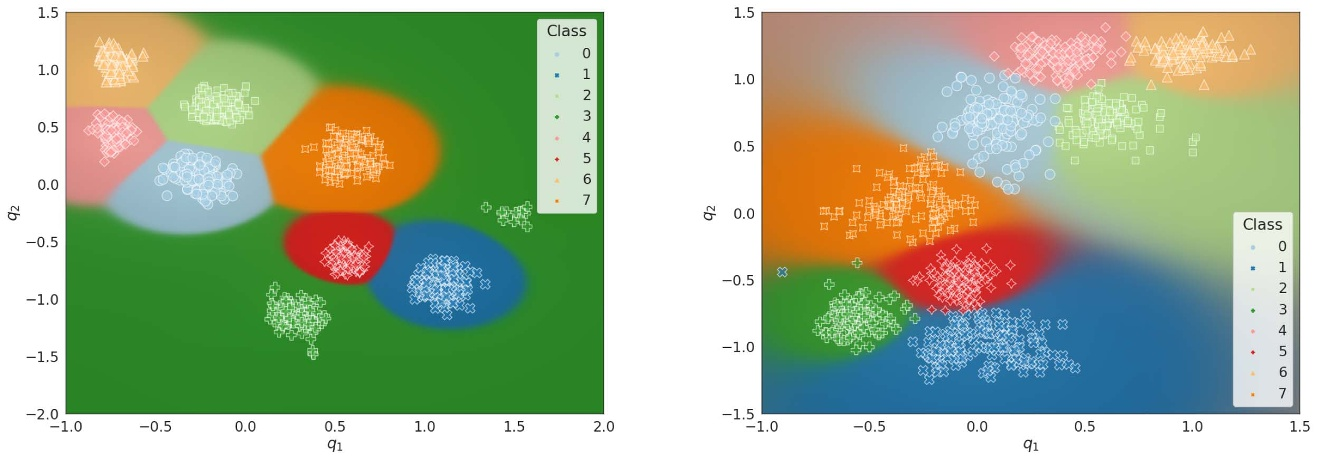
This is why the picture matters beyond convenience. In medicine or science, knowing why something was classified a certain way can be as valuable as the classification itself, and most competing methods do not offer this view.
How the plot is built
For \(D=2\) the instances \(\boldsymbol{q}=L(\boldsymbol{x})\) and the scalar field derived from the vortices can be shown together. Each class is assigned a colour, used both for its instances (the dots) and for the region where its scalar field is the greatest (the background). The plot does not replace any evaluation metric, but it is a quick and intuitive way to interpret the problem and the logic the replicant applies to segment the instances.
- Instances of one colour on a background of the same colour are correctly classified: the class of the instance and the class of the field match.
- An instance on a background of another colour is misclassified, visible at a glance.
- Compact, well-isolated groups, occupying small areas with large distances between them, mean the logic is clearly defined and the replicant is more precise than one with wider groups.
- Two groups of the same colour far apart, with other classes between them, mean the class was segmented into logically distinct sub-groups. There is no limit to the number of segments a class may have; it depends directly on the logic found.
Two replicants, one problem
In (a) the groups are compact, occupy smaller areas, and the distances between them are greater and better defined; every instance sits on its own colour, and class 3 appears as two distinct groups so far apart that other classes lie between them. In (b) the groups belonging to different classes are more closely clustered, wider, and several instances sit on a background of a different colour. The plot on the left shows a replicant that learned a clearer logic and learned it more precisely.
Small and large datasets
With few instances the plot is readable at a glance: groups can be identified immediately. Larger datasets may exhibit more or wider groups, so more time may be needed to examine them, but the plot still shows the logic applied by the replicant. The next page covers what to look for when auditing a trained replicant and how this differs from other two-dimensional views.